IncidentMonitor™ 9.7.53 Released! The User Experience Improvement Release
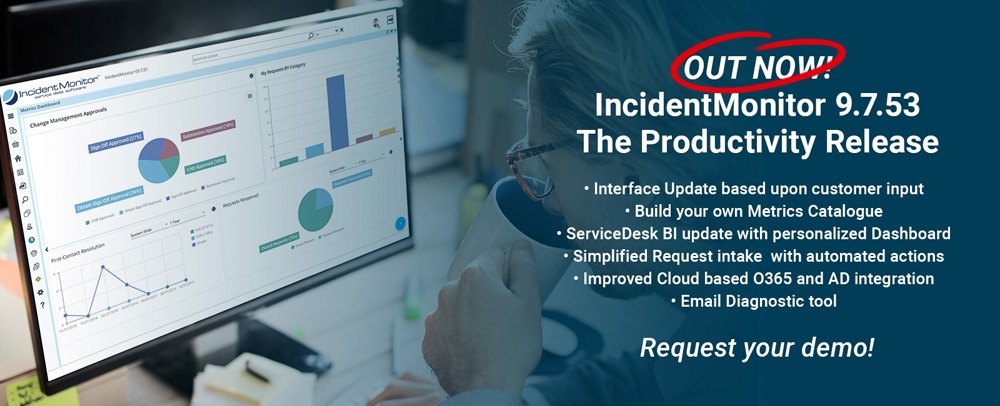
We are excited to announce a new release of IncidentMonitor™. With IncidentMonitor™ 9.7.53 we have have improved our user experience once again. Following our last release we further improved the interface to increase the ease-of-use and add new enhancements. We are grateful of all the contributions of our clients and are confident that this release will help our user community to increase their productivity.You can read the updates below or relax, sit back and let us show you what we did and watch the video below!
Prefer an interactive demo? Don't hesitate, request your demo now.
Enhanced UI
We’re continually improving our User Experience. This release is our best yet. We’ve improved the layout, configurability, ease-of-use and look and feel. Listening to the feedback from our user base we’ve improved the User Experience in a very practical way – based on what our user community was asking for.

Not only have we improved how great IncidentMonitor now looks we’ve also improved the ability to extract information. You can now build graphical reports in your views by dragging the columns to the grouping area and selecting the type of graph. Below is an example of a trend graph where the requests are graphed by Status (i.e. what the grid was grouped by) and are trended by the open date of the request (we are looking at open requests – it would be closed date if we were viewing closed requests).

Note that this graph can then published as a metric for display in the new My Metric Dashboard or the legacy My Portal-> My Home Page with a click of the metric icon in the top left.
A good portion of our windows have been “modernized” (more to come) as shown in the screen shot below of the new My Settings which replaces the My Preferences and My Profile windows.

Also note that the windows now have a quick access “Speed Dial” (the blue circle at the bottom right) to window level options that are also keyboard driven. Hovering over the options provides details of the action and the quick key.
We have also refreshed the end users (i.e. Contacts) interface to provide a more fluid user experience. Below you can see the redesigned My Requests for the end user – a much cleaner look.

We’ve also created a brand new, new request form for the end users (you may not want to design your own with our Forms/Portal Designer 😉 ). Fully equipped with contextual validation checks as can be seen by the red exclamations marks in the screen shot below.

And finally, opening an existing request has been completely redesigned with the milestones up top and the display of the form with speed dial for the screen level options that is contextual (i.e. if this were an approval the approve and reject actions would be visible).

Azure/O365 Integration
We have added full integrated O365 and Azure Single Sign-On out-of-the-box. This does require a few steps in your Azure AD and copying some of that information to your global.asax file in your IncidentMonitor installation and is thoroughly documented in our O365 & Azure AD Integration.pdf found in the manuals directory.
The login screen has been changed to provide the various options for logging in.

Once configured correctly the IncidentMonitor icon will also appear in your Office 365 portal and can launched directly from here – as shown below.

Resource Request Intake
After many iterations of our Resource Request Creation we are confident that this version is going please everyone, we’ve listened intently to everyone’s feedback and incorporated that into a single, sleekly designed UI.

It says BETA but don’t let that fool you, It is fully functional , the only reason why it says BETA is we anticipate further feedback/enhancement suggestions. To enable this view go to My Settings and change the option of New Request Format as shown below.

Metrics Dashboard
One of the coolest things we’ve released in a long time is our new Metrics capability. In any Grid View, this includes output from our new Service Desk BI, once you have grouped and graphed your data you can then save that Metric for use in our new Metrics Dashboard or the Legacy Dashboard.

Once the metric is published it is then available for use in the either of the Dashboards.


Want to learn more about this great feature? Read the blog from last week and learn how you can use the metrics dashboard to extract value for the business.
In conjunction with the new Metrics capability is our new Service Desk BI where you can easily build complex queries to extract any metric possible. So below is a common Change metric everyone needs – we’re answering the question of “What is the Success rate of our Change Approvals (i.e. Did we have any Rejected Changes)”. In the screen shot I have selected the Change Project and set a field rule for those requests that have had either Approved or Rejected items applied (this is based on the current Change Approval process).

I specify the Task Name and the Request # as output columns and receive the following.

Now that I have the output I simply drag the column name to the grouping band as shown below and select to view it as Pie Chart and voila!! You have your instant metric that every Change Manager wants and needs.

Now I can click the metric icon and publish the Metrics Catalogue for use in a Metrics Dashboard. Very cool stuff.
Email Diagnostics
We always think that email is slowly dying. On the contrary it seems to be more prevalent than ever and is a widely used conduit for service desks. Up until now we had to rely on SMTP logs to track down “lost” emails which are never lost they were either discarded or appended to an existing request based on the inbox handler settings. We’ve now created an Email Diagnostic tool to help you track down where that missing Email went. When turned on we will log who sent it, when they sent, what we read and what action we took with the email. This way you can always trace down those phantom emails. More details about this feature can be found in our blog DID YOU RECEIVE MY E-MAIL? from a few weeks ago.

If you want to learn more you can contact your sales rep. Go to our support site to download the full details of this release. You can find this in the document section.